Poverty among families supporting a child with a disability: A longitudinal analysis
Said Shahtahmasebi, PhD
The Good Life Research Centre Trust, Christchurch, New Zealand.
Correspondence: Email: radisolevoo@gmail.com
Received: 23/4/2021; Revised:12/5/21; Accepted: 16/5/2021
Key words: Income poverty, social circumstance, family hardship
[citation: Shahtahmasebi, Said. (2010). Poverty among families supporting a child with a disability: A longitudinal analysis. DHH, 8(2): http://www.journalofhealth.co.nz/?page_id=2507].
[Note: this article provides a summary of the analysis previously published in full in the International Journal of Disability & Human Development – please see: Shahtahmasebi, S. Emerson, E. Berridge, D. and Lancaster, G. (2010) A longitudinal analysis of poverty among families supporting a child with a disability.. Int J Disabil Hum Dev 8(4): 417-438.]
Abstract
This paper addresses the relationship between poverty and the presence of a child with a disability in the family using longitudinal data from a secondary source. Longitudinal data provide additional lever to account for the possibility that substantial variation in poverty between respondents will be due to omitted variables, multicollinearity and past behaviour. Furthermore, additional information is included by creating three categories of poverty, namely; no poverty, moderate poverty, and severe poverty. A multinomial random effects model is fitted to the data. The results suggest complex interactions between observed and unobserved variables; that supporting a child with a disability might lead families out of income poverty; and the distinction between moderate and severe poverty appears to improve the results.
INTRODUCTION
Transition in and out of poverty or disability may be subject to the status of the economy and social support policies. Child disability may lead to the prevalence of poverty if a household were not previously in a state of poverty. Temporal dependencies due to individuals themselves, e.g. personality, the good feel factor, and frailty, may influence poverty outcomes. These and other issues relevant to household poverty when looking after a child with disability are discussed in earlier papers (1-3). It is not possible to address these issues with cross-sectional studies (4). Longitudinal data is required. In order to assess the degree to which explanatory variables influence poverty, an adequate statistical model must allow control for omitted variables, multicollinearity and past behaviour. In this paper additional information is introduced to account for past behaviour and temporal dependencies such as family adjustment after a disability (5), in order to gain additional insight in the dynamics of family poverty.
Poverty is defined using three indicators measuring households’ monetary levels, households’ spending/saving power, and perceived consequences of the latter two i.e. hardship. For this analysis, instead of the usual dichotomy of ‘poverty’ vs ‘no poverty’ we distinguish between moderate and severe hardship. Furthermore, we investigate the multinomial poverty within a longitudinal statistical modelling paradigm.
METHODS
Sample
We undertook secondary analyses of data collected in Waves 3-7 (2001-2005) of the Families & Children Study (FACS) (6, 7). These data contain a wide array of variables relating to income poverty and other indicators of socio-economic deprivation (8). Relevant data files and supporting documentation for Waves 3-7 of FACS were obtained from the UK Data Archive.
Identifying Disabled Children
A child identified as being disabled if the informant replied in the affirmative to either of the following two questions: (1) ‘Does [name of child] have any long-standing illness or disability? By longstanding I mean anything that has troubled [name of child] over a period of time or that is likely to affect [child’s name] over a period of time?’; (2) ‘Has [name of child] been identified at school as having a Special Educational Need (SEN)?’. In addition the informant had to reply in the affirmative to either of the following two questions related to impact: (1) ‘Do/Does/Will this problem/any of these problems affect [name of child] ability to attend school or college regularly?’ or (2) ‘Do/Does/Will this problem/any of these cause you to spend more time caring for [name of child] compared with a fully-fit child of similar age?’
This approach identified 10-13% of dependent children as being at risk of disability at any given wave, and 17-23% of families with dependent children as caring for a disabled child. These prevalence estimates are toward the middle of the range of prevalence rates (3-16%) reported in previous UK studies of child disability (9, 10).
Indicators of Poverty
Three indicators related to poverty were used: income poverty (based on equivalised household income); hardship (based on access to assets and resources); and financial strain (based on the adult informants’ appraisal of the degree of financial strain experienced).
Income poverty: FACS contains information from which equivalised household income (calculated both before and after the deduction of housing costs) can be calculated. Following common practice, income poverty was defined as equivalised household income before the deduction of housing costs falling below 60% of the national median for the reference year in question (11).
For the purpose of these analyses, equivalised household income before the deduction of housing costs falling between 40% and 60% of the national median was classified as moderate income poverty, and income below 40% of the national median was classified as severe income poverty.
Analysis
At each wave for which data were available, each family was classified as being in severe/moderate/no poverty, the poverty history of each family being represented by a sequence of ordinal outcomes. A statistical modelling approach was adopted. In order to assess the degree to which explanatory variables influence poverty, an adequate statistical model must handle the possibility that substantial variation between respondents will be due to omitted variables, multicollinearity and past behaviour. Longitudinal modelling allows the inclusion of omitted variables by adding a family-specific random effect and past-effect variables. The latter variable simply the poverty status at previous wave (1, 2, 4). Models were fitted using the Sabre 6.0 statistical software package (http://www.sabre.lancs.ac.uk/), also see (4).
The multinomial logistic random effects models were used to investigate the extent to which differential rates of transition could be attributed to between-group differences in family demographics and socio-economic position. The general approach taken in this modelling was, in the first instance (Model 1, Table 1a&b), to determine the strength and statistical significance of the association between child disability status and the poverty indicator of interest (income poverty, hardship, financial strain). Following this (Model 2, Table 1a&b) we determined the strength and statistical significance of the association between child disability status and the poverty indicator of interest (income poverty, hardship, strain) once the effects of between-group differences in potential ‘confounding’ variables were taken into account. Both models control for the residual heterogeneity (omitted variables) by default.
In the modelling, all potential explanatory variables were fitted in the model one at a time and their contribution to explaining the variation in data in terms of the change in deviance was noted. Those variables whose effect was not statistically significant were dropped. The variables with the largest effect were included in the model and the remaining explanatory variables were tested in this new model one at a time. The process of variable selection continued until there were no variables remaining significant at 5%.
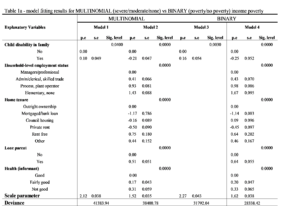
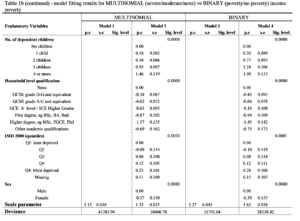
For the purpose of comparison, the binary logistic random effect model was also fitted to the data using the same variables which were selected using the multinomial logistic model. The full results are shown in Tables 1a&b: model 1 and model 2 are the results from fitting the multinomial logistic model and model 3 and model 4 from fitting the logistic binomial models.
RESULTS
Two models were fitted: ‘child disability’ on its own (model 1) and after controlling for other socio-economic variables (model 2).
One of the main features of the results shown in Tables 1a&b is that the included household specific variation indicating omitted variables effect (scale parameter) is highly significant even after controlling for socio-economic variables. A significant scale parameter provides strong evidence that substantial variation in data is left unexplained by the models. This result justifies the deployment of the adopted statistical modelling approach. This means that applying standard and cross-sectional methods to such dynamic processes will lead to erroneous results and misleading conclusions.
Income poverty: ‘child disability’ is only marginally significant on its own in this model and its effect on income poverty appears to be in the expected direction, model 1, Table 1a. The negative parameter estimate suggests that the presence of ‘child disability’ increases the likelihood of belonging to severe, or, moderate or severe income poverty. In fitting model 2, once the variable ‘Household-level employment status’ is controlled for, the ‘child disability’ variable ceased to be statistically significant. However, as the interest of the analysis centred on this variable, ‘child disability’ was forced into the final model of socio-economic variables. Model 2 in Table 1a, shows the results after controlling for socio-economic factors. The results suggest that ‘child disability’ is now highly significant but affecting poverty in the opposite direction. This counter intuitive result may be due to the interaction(s) between ‘child disability’ and one or more of social variables such as higher numbers of children, lone parenthood, poor state of health, and not in own home. The results in Table 1a&b suggest that after controlling for socio-economic factors there is a substantial increase, six times its standard error, in the effect of ‘child disability’ from -0.10 to 0.21. In other words, the presence of disability appears to decrease the likelihood of belonging to the severe, or, severe or moderate income poverty categories. The results also suggest that on average income poverty increases for those in the lower socio-economic groups e.g. those working in the non-managerial or non-professional occupations; those without any qualifications; and lone parents appear to do worse than their counterparts. Those in rent free and ‘other’ accommodation appear to do worse than owner occupiers. Being in good health appears to decrease the likelihood of poverty. The gender effect is significant and suggests that females do better than males.
DISCUSSION
The binary model uses less information and generally tends to overestimate parameters. For example, in the binary models (3 & 4) of Table 1a&b, the parameter estimates for some categories of the variables ‘employment status’, ‘home tenure’, ‘lone parent’, ‘number of children’ and ‘qualification’ are slightly larger than those from multinomial models (1 & 2). In some cases, this change is statistically significant, e.g. the change in the parameter estimates of categories ‘elementary, none’ and ‘council housing’, from model 2 to model 4, is three (3) times their standard errors. Therefore, more reliance can be placed on the results from the Multinomial.
The impact of ‘child disability’ on income is only marginal but in the expected direction and ceases to be significant after controlling for ‘household-level employment status’. Therefore, this variable is dropped out of the model selection process. However, ‘child disability’ was forced into the final model of income poverty leading to astonishing and counterintuitive results.
Firstly, child disability appears highly significant in the final model. Secondly, and more interestingly, the results suggest a reverse effect, i.e. child disability in the family is likely to lead families supporting a child with a disability out of income poverty.
As evident in the Table 1, the child disability variable is marginally significant without any statistical control and suggests an association with income poverty. After controlling for other socio-economic factors the effect of this variable is reversed. The highly significant ‘scale parameter’ informs us that there is substantial variation in data due to omitted variables has been left unexplained by the models. In addition, there is also the possibility of measurement errors and serial correlation due to the inclusion of subjectively measured variables and structural error term which may lead to counterintuitive and erroneous results (4).
Of course, ‘child disability’ should not have featured in the final model since it was not significant and dropped during the variable selection process. So the results reported in Table 1a&b, may well be an artefact of complex interactions between observed socio-economic and unobserved dynamics of exogenous variables such as social and welfare policies.
As shown in Table 1a&b, the scale parameter is highly significant in all models suggesting a significant amount of variation left unexplained by the included variables. Therefore how socio-economic variables interact with each other as well as with the omitted variables may have an effect on the ‘child disability’ variable. On the other hand, income may be directly manipulated through the various social and health and disability benefits which may also, to some extent, explain the counterintuitive results for ‘child disability’ in Table 1a.
Analyses of the same data set, to be reported in the next issue of DHH, suggests any income increase through receiving social, health and disability benefits do not appear to have any bearing on hardship and financial strain.
CONCLUSIONS
The results reported in Table 1a&b are consistent with the variable ‘child disability’ in the family having an intervening effect between social variables and poverty as opposed to having a direct effect. The highly significant scale parameter emphasizes the importance of adopting a methodology which allows control for residual heterogeneity (omitted variables). Furthermore, incorporating additional information, e.g. the distinction between severe and moderate poverty, appears to enhance the results.
ACKNOWLEDGEMENT
Based on research conducted by Professor Eric Emerson funded by the Economic and Social Research Council (RES-000-22-2874).
REFERENCES
- Emerson E, Shahtahmasebi S, Berridge D, Lancaster G. Factors associated with poverty transitions among families supporting a child with intellectual disability. Journal of Intellectual and Developmental Disability 2010;35(4):1-37.
- Shahtahmasebi S, Emerson E, Berridge D, Lancaster G. Child disability and the dynamics of family poverty, hardship and financial strain. Journal of Social Policy 2010;under review.
- Shahtahmasebi S, Emerson E, Berridge D, Lancaster G. Child disability, parental self-rated health and food security: A multivariate cross-sectional analysis. Int J Disabil Hum Dev 2009;8(4):417-38.
- Shahtahmasebi S, Berridge D. Conceptualising behaviour in health and social research: A practical guide to data analysis. Merrick J, editor. New York: Nova Sci, 2009.
- Mazur E. Negative and positive disability-related events and adjustment of parents with acquired physical disabilities and of their adolescent children. Journal of Child & Family Studies 2008;17(4):517-37.
- Hoxhallari L, Conolly A, Lyon N. Families with children in britain: Findings from the 2005 families and children study (facs) Leeds: Corporate Document Services: Department for Work and Pensions Research Report No 424; 2007 Contract No.: Document Number|.
- Lyon N, Mangla J, Tait C, Scholes S. Families and children study(facs) 2005, wave 7. London: National Centre for Social Research.; 2007 Contract No.: Document Number|.
- Emerson E, Hatton C. The socio-economic circumstances of children at risk of disability in britain. Disability & Society 2007;22(6):563-80.
- Gordon D, Heslop P. Poverty and disabled children. In: Dorling DS, L. . Statistics in society. London: Arnold, 1998.
- Gordon D, Parker R, Loughran F, Heslop P. Disabled children in britain: A re-analysis of the opcs disability surveys London: The Stationery Office; 2000 Contract No.: Document Number|.
- Shaw M, Galobardes B, Lawlor DA, Lynch J, Wheeler B, Davey Smith G. The handbook of inequality and socioeconomic position: Concepts and measures. Bristol: Policy Press, 2007.
- Pantazis C, Gordon D, Levitas R, (Eds). Poverty and social exclusion in britain: The millennium survey. Bristol: Policy Press; 2006.
- Noble M, McLennan D, Wilkinson K, Whitworth A, Barnes H, Dibben C. The english indices of deprivation 2007. London: Communities and Local Government, 2008.
- Ginsberg RB. Semi-markov processes and mobility. Mathematical Sociology 1971;1:233-62.
- Davies R, Flowerdew R. Modelling migration careers using data from a british survey. Geographical Analysis 1992;24:35-57.